Getting Exposure Right in the Digital Camera

A while ago, someone asked me how to get rid of the little graph that kept showing up on her camera's LCD screen. I could only assume that she was trying to make it go away so she could see the full size, unobstructed picture of her drunken uncle with the lamp shade on his head? Although I am confident most of my audience understands the value of the histogram, this article is for those who are still trying to figure out how to make it go away - DON'T. In a future article, I will be getting more technical, but this week I would like to show how a simple understanding of the basics can make a world of difference in your control of exposure. Anyway, that little graph is called a histogram and it is the essential key to unlocking optimal exposure, every time.
This week, to continue my series on "Getting It Right In The Digital Camera", I will begin a discussion about getting exposure right in the digital camera. So far I have discussed the control of focus and of perspective, but for me, the improvement in my ability to control exposure has been the most significant benefit of my change from film to digital photography. With film it took great care to assure a properly exposed image and even with the help of light metering and bracketing, I still couldn't be sure that I nailed it until the pictures came back from the lab or were revealed in the development tray. Now it all comes down to the histogram, and with the use of this marvelous tool there is no excuse for a poorly exposed image. If you want to take a bad picture you must simply find another way to do it.
Find the Histogram
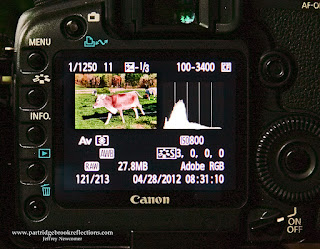
The LCD image on the back of essentially all digital camera can be
 very useful. It is helpful for a rough review of composition, and an even rougher assessment of focus, but it is should not be relied upon for exposure monitoring. The best exposure is often not the one that looks best on the screen. The brightness of the LCD image is affected by the JPG rendering that is done in camera and also on the brightness you have set for the LCD screen itself. The primary reason I look at the LCD is to evaluate the exposure from the histogram. The histogram is simply a visual representation of the range of brightness in your images. Brightness varies from the blackest black on the left to the whitest white on the right. If you are shooting 8 bit jpg images, that brightness range is divided into 256 steps. In RAW at 14 bit the dynamic range is divided up into over 14,000 steps – you should be shooting in RAW. Regardless of the bit depth, at every point on the graph the height of the column is proportional to the number pixels at that level of brightness.
 Study the Histograms
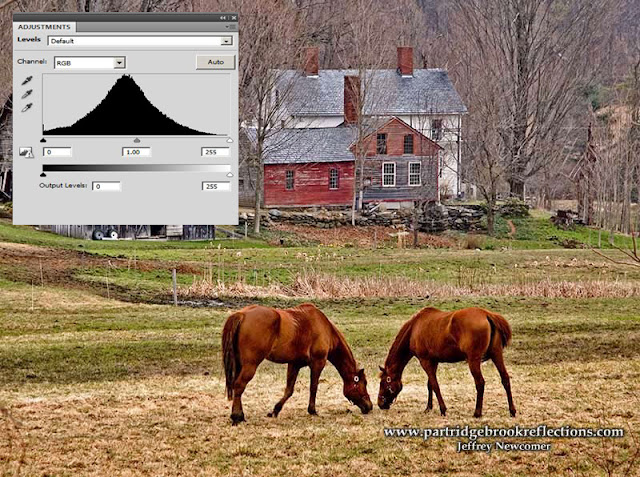
The best way to understanding what the histogram is showing is to study the graphs for a range of images. In the wildflower photograph, the histogram shows a full dynamic range with a bias toward darker tones (to the left).
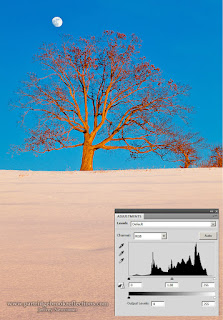
 The histogram for the winter picture of the hill-top Oak at Alyson's Orchard, is shifted to the right by the preponderance of bright tones. The slight tail extending to the far right represents the brightness of the moon whereas the few deep shadows in the tree explain the tail to the left. In a photograph dominated by a bright sunny beach the histogram columns will be shifted far to the right, while a dark, shady forest will be represented by columns bunched over to the left side. An extreme example is seen in the silhouette image of a Frigate on the Galapagos Islands. Here there is only bright light and deep shadow and the histogram shows the two peaks at opposite ends of the dynamic range.
The histogram of a low contrast image will float in the middle of the graph without extreme whites or blacks. How to best position this truncated graph is a discussion for another time, but think "expose to the right".
Control Exposure with the Histogram
Every image will have its own distinct natural pattern, but in digital photography the goal should be to capture the range of brightness that will provide your editing program with the information it needs to show quality detail throughout your desired dynamic range. There is no "ideal" histogram. The best exposure, and therefore the best histogram, depends on the dynamic range of the subject and the artistic goals of the photographer.
My routine approach is to lock down my initial settings in aperture or shutter priority, depending on whether depth of field or shutter speed is most important. I don't worry a great deal about other setting until I have taken my first image. That first picture is primarily for metering the scene. Once I have seen where the graph lies I will have a good sense of how the final exposure will need to be approached
Avoid Clipping
It is most important to check the general position of the graph. To assure that there is no significant loss of detail in the brightest highlights of the image or in the shadows.
If the histogram is shifted too
 |
| Right Shifted |
 |
| Highlights Recovered |
There will be times when it is ok to blow out the extreme highlights, when it is not necessary to find detail in some highlight areas. The classic example is when specular reflections are recorded, such as bursts of sunlight reflecting off a chrome automobile fender or sparkling light on ocean breakers. In these situations as well, the histogram is essential to controlling the results. The sunflower picture has a spike at the far right of the histogram, but these "blown" highlights are in the direct sun where no detail is expected or possible.
 |
| Sun Clipping |
Excessively dark images
 |
| Left Shifted Histogram |
 |
| Shadow Detail Recovered |
When dynamic range is high, it may not be possible to protect both highlights and shadows and compromises need to be made. Using the histogram, I will often increase exposure until important highlights begin to be compromised and then back off slightly. This is called "exposing to the right" and although it often does not yield the prettiest picture on the LCD, there are good reasons why, regardless of the dynamic range, this is usually the optimal approach to positioning the histogram . But I will reserve that discussion is for another time.
For now, get into the habit of reviewing your histograms. Understand what they represent and then use this to get all the exposure data you will need to fulfill your vision of the scene. Your drunken uncle probably will appreciate having his indiscretion obscured by the graph and you will get a perfectly exposed record of the event.
Check out Part Two of Getting Exposure Right in the Digital Camera: Exposing to the Right


It is extremely helpful for me. Thank you for taking the time to discuss this. I feel strongly about it and love learning more on this topic. If possible, as you gain expertise, would you mind updating your blog with more tips.
ReplyDeleteclippingpath
In photography there is a reality so subtle that it becomes more real than reality.
ReplyDeleteclipping path
Thank you so much for a well explained article. It has helped me on my photographic assignment :)
ReplyDelete
ReplyDeleteNice article. Thanks for sharing.
Artificial Intelligence Courses Online
Artificial Intelligence Training in Hyderabad
Artificial Intelligence Online Training Institute
Artificial Intelligence Training
Artificial Intelligence Training in Ameerpet
Artificial Intelligence Course in Hyderabad
Artificial Intelligence Online Training
AI Training In Hyderabad
AI Online Training